
Precise Measurement of νμ → ντ Oscillation
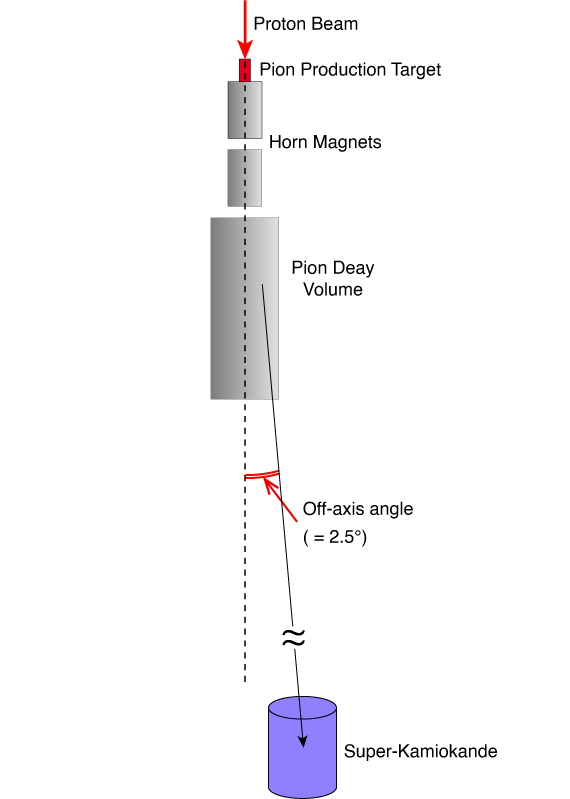 Figure 1 : Concept of the off-axis method at the T2K experiment.
|
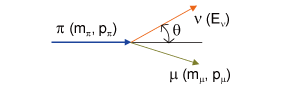 Figure 2 : Decay mode of a charged pion. (π+ → μ+ + νμ ) |
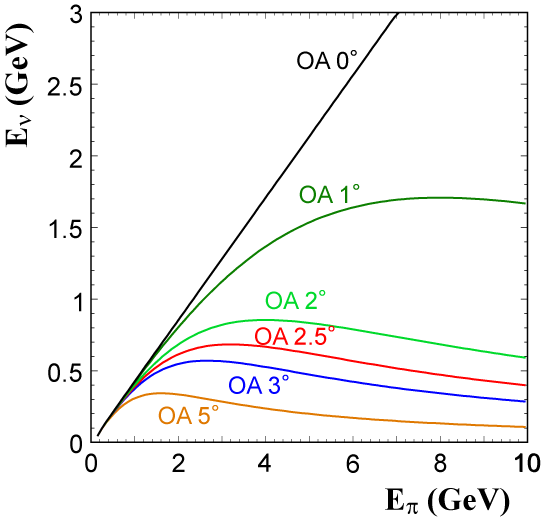 Figure 3 : Relations between energy of charged pions (Eπ ) and that of produced neutrinos (Eν ) for various neutrino off-axis angles. |
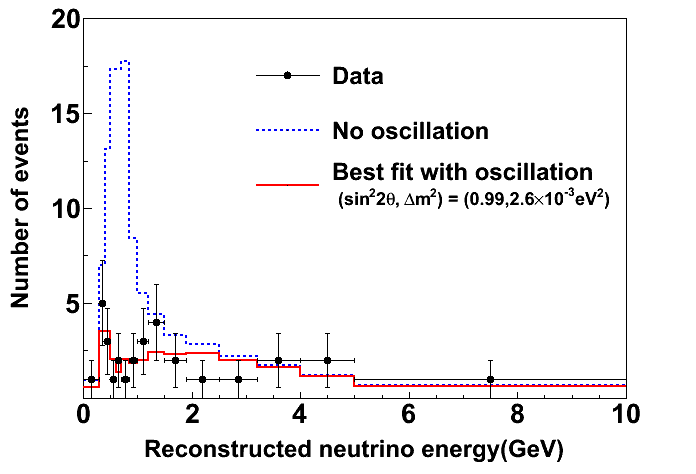 Figure 4 : Energy spectrum of the reconstructed νμ at Super-Kamiokande. The blue histogram show the prediction if oscillation does not occur, and the black dots with error bars show the spectrum actually observed. The red histogram represents the spectrum of the best-fit neutrino oscillation parameters. |
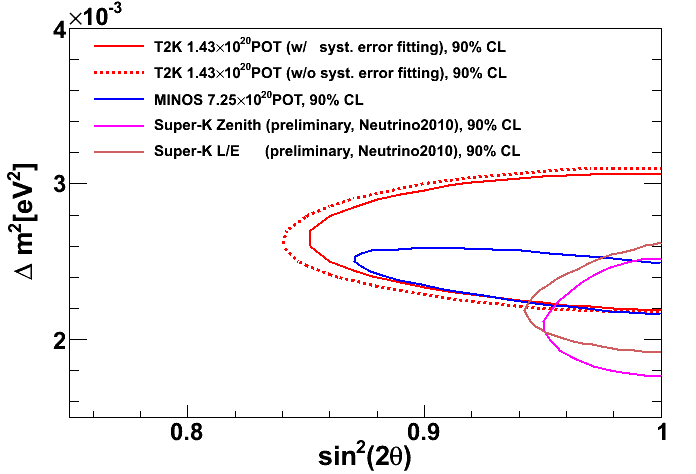 Figure 5 : The allowed region of the neutrino oscillation parameters, θ23 and Δm232 obtained from the T2K experiment (red solid line and dotted line). The results from the MINOS experiment (blue solid line) and the Super-Kamiokande (magenta and blown solid lines) are overlaid. |
Previously, we reported that the T2K experiment, in which the High Energy Physics Laboratory at Osaka City University participates, was the first in the world to observe signs of νμ → νe oscillations due to the appearance of electron neutrinos. This time, we would like to report on the measurement of νμ → ντ oscillations.
The νμ → ντ oscillation, one mode of neutrino oscillations, was first observed in 1998 in the measurement of atmospheric neutrinos at Super-Kamiokande. Its existence was later confirmed in experiments using artificial neutrino beams, such as the K2K experiment conducted at the High Energy Accelerator Research Organization (KEK) and the MINOS experiment at the Fermi National Accelerator Laboratory (Fermilab) in the United States. One of the objectives of the T2K experiment is to measure these oscillation parameters with high precision.
The T2K experiment introduced the off-axis method to precisely measure νμ → ντ oscillations (Figure 1). This method intentionally shifts the central axis of the neutrino beam generated at J-PARC away from the direction of the far detector, Super-Kamiokande. As shown in Figure 2, νμ is generated from the decay of charged pions π+ → μ+ + νμ. Since this is a two-body decay, the energy of the neutrino Eν can be expressed using the momentum pπ and energy Eπ of the parent particle, the charged pion, and the scattering angle θ of the neutrino as follows:
\begin{align*}
\displaystyle
E_{\nu} = \frac{m^2_{\pi} – m^2_{\mu}}{2(E_{\pi} – p_{\pi}\cos\theta)}
\end{align*}
Here, mπ and mμ are the masses of the charged pion and muon, respectively. If we plot Eπ on the horizontal axis and Eν on the vertical axis for various θ, we get a graph like Figure 3. When θ = 0, Eν increases proportionally to Eπ, but as θ increases away from 0, Eν remains almost constant, regardless of Eπ. Utilizing this property, we can create a high-intensity neutrino beam with a narrow energy range. From the measurements at Super-Kamiokande and the K2K experiment, we roughly know the parameters for νμ → ντ oscillations, so the T2K experiment can efficiently and more precisely measure the oscillation parameters by selecting the neutrino energy that maximizes the oscillation. This so-called “magic energy” depends on the flight distance of the neutrinos before detection. Considering the 295 km distance from J-PARC to Super-Kamiokande, this energy is 0.65 GeV, and the neutrino angle was set to 2.5° to peak at this energy. Figure 4 shows the measurement results under these conditions. The blue histogram shows the expected νμ energy spectrum at Super-Kamiokande if νμ → ντ oscillations do not occur. Thanks to the off-axis method, it has a sharp peak at 0.65 GeV. In contrast, the actual observed spectrum is shown by black circles with error bars. The peak at 0.65 GeV is not observed, and overall, only 31 events were observed compared to the 104 expected if there were no neutrino oscillations. The νμ corresponding to this difference likely disappeared and changed to another flavor of neutrino. Furthermore, since the corresponding νe was not observed, most of the disappeared νμ are thought to have oscillated to ντ. From these results, the allowed range for the mixing angle θ23 and the squared mass difference Δm232 between the neutrino mass eigenstates ν2 and ν3 was obtained as shown in Figure 5. The best-fit values are sin2(2θ23) = 0.99 and Δm232 = 2.6 × 10⁻³ eV2, and with 90% confidence, sin2(2θ23) > 0.85 and 2.1 × 10⁻³ < Δm232 (eV2) < 3.1 × 10⁻³. Figure 5 also shows the results from the atmospheric neutrino observations by Super-Kamiokande and the MINOS experiment. The T2K results are consistent with these findings. An interesting point is that the value of sin2(2θ23) is nearly 1, indicating that the mixing angle is almost at its maximum. Whether this is a coincidence or has deeper physical implications is currently unknown. However, the T2K experiment plans to continue collecting more data for even more precise measurements in the future.